
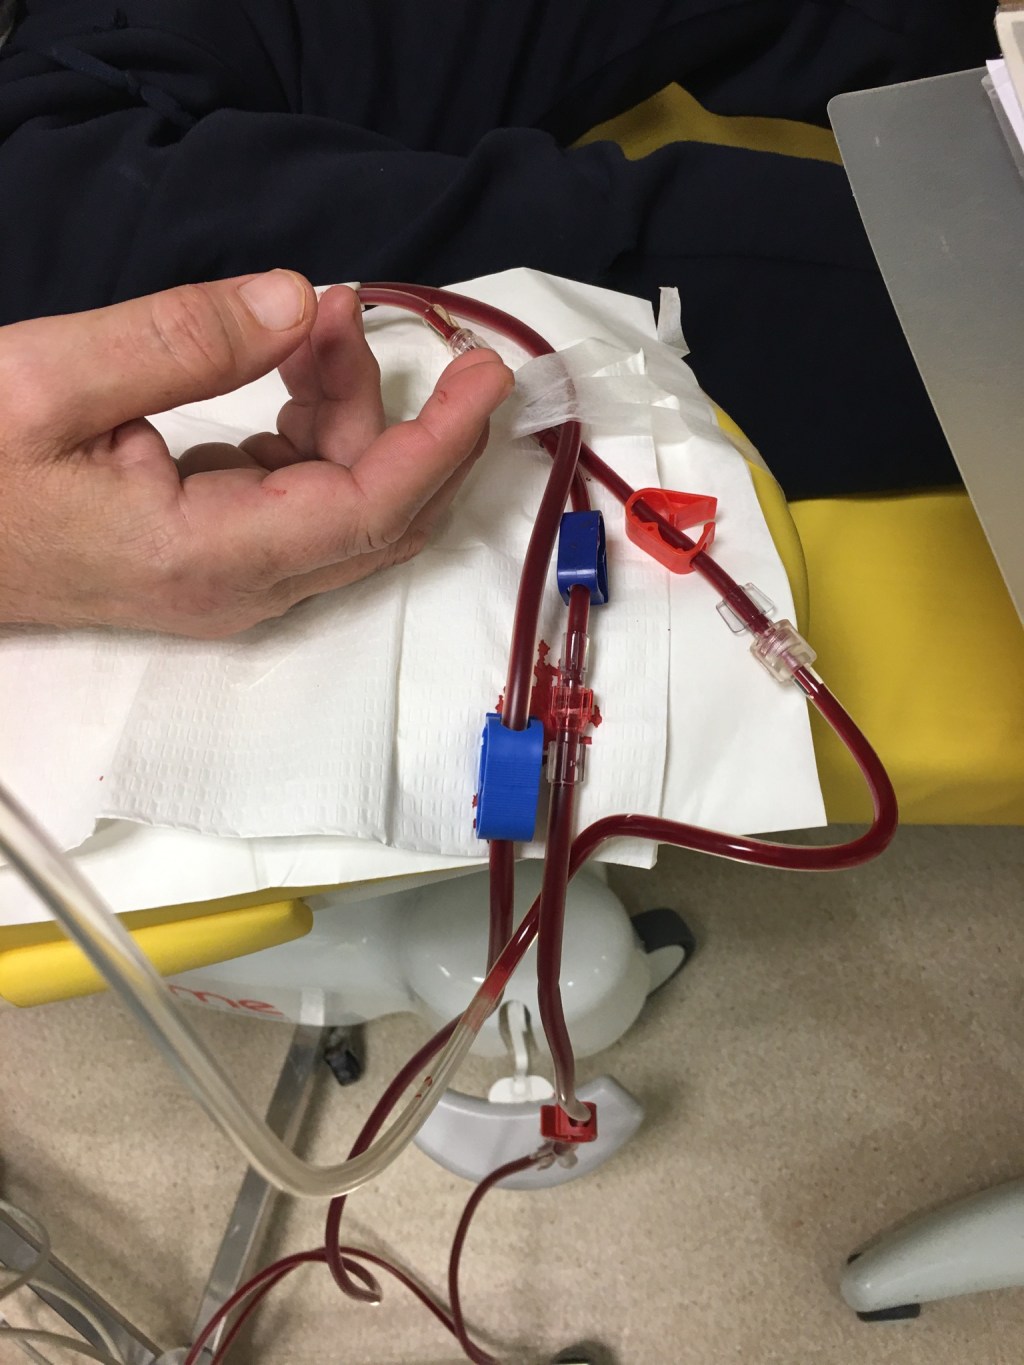
The bottom line here was that we thought we had a reasonable theory that a continuous estimation of real-time blood pressure during dialysis could be derived for continuous monitoring of the arterial and venous lines taking blood to and from the dialyser. However, it’s a long way from there to a robust set of hardware and software backed up by hundreds of patient studies and millions of data points.
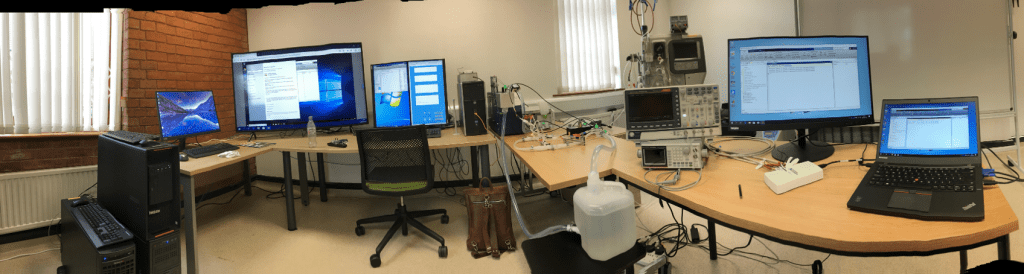
It all started in my lab in Lonsdale House at Derby University where Prof Jill Stewart and I designed and built a desktop cardiovascular robot called ‘Steve’, controlled in real time by Matlab and Simulink, complete with pulsatile heart, controllable vasoconstriction and compliance, vasculature, and an ‘arm’ with a fistula which was needled as with a real patient. It’s a tribute to Jill’s expertise in fluid dynamics that the data we were getting from the simulator was very close to the real thing.
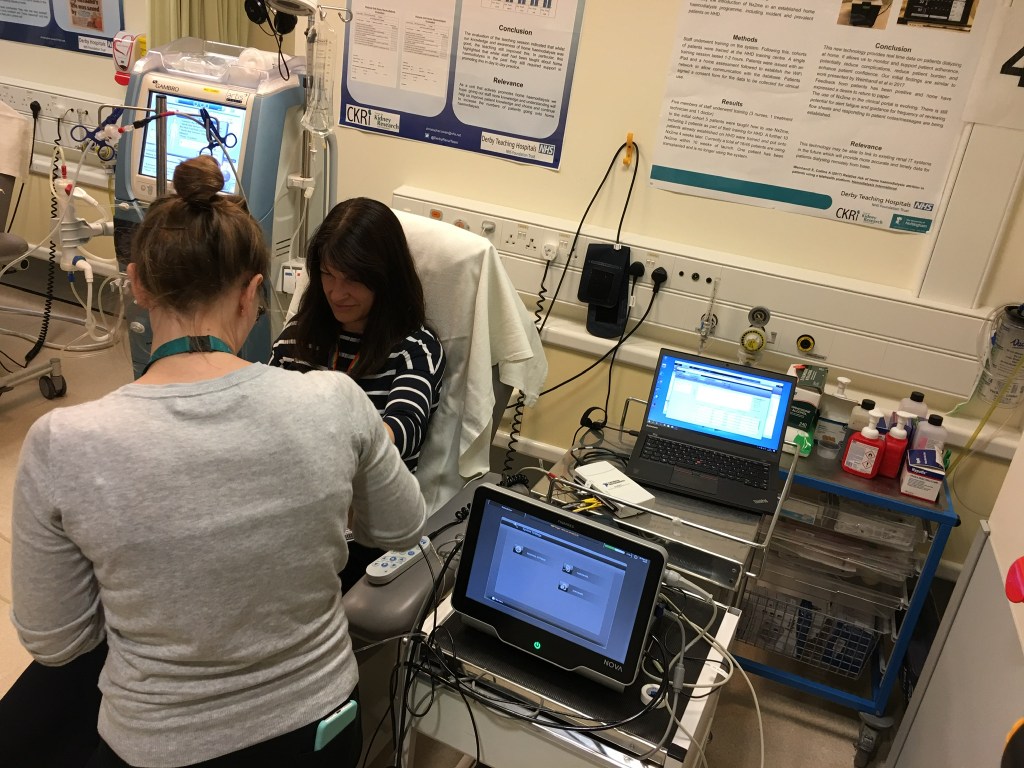
This meant that we could simulate and monitor pretty well any situation while dialysing the ‘patient’. It was this rig which was the platform on which the design and performance of various iterations of hardware and software were investigated before being rolled out into observational patient studies ar Royal Derby Hospital.
‘Steve’ was our original hybrid digital twin with hardware in the loop. When we for the first time tracked a hypotensive episode in real-time between arm cuff measurements, our first thought was how much the response looked like ‘Steve’s’ response


Leave a comment